- Published on
k8s 에서 node-exporter 를 통한 nextjs 서버 모니터링
nextjs 서버를 k8s 를 통해 운영하고 있는데, 해당 nextjs 서버를 node exporter 를 통해 모니터링 하는 방법에 대해 알아본다.
상황
k8s 클러스터에서 앞에 Ingress Nginx Controller 를 두어 트래픽을 받는다면 ingress-nginx 에서 NGINX Prometheus Exporter 를 통해서 트래픽에 대한 로깅정보를 내보내서 모니터링을 하고,
별도로 nextjs pod 에 대한 리소스를 모니터링 할 수도 있다.
하지만 이번의 nextjs 서버 경우는 k8s Service 를 NodePort type 으로 설정하여 외부로 노출 시키고 외부의 LB 를 통해서 트래픽을 받고 있다.
그래서 ingress-nginx 를 통한 트래픽에 대한 모니터링은 못 하고 있었다.
따라서 nextjs 로 들어오는 트래픽 및 서버리소스 로깅 정보를 모니터링 할 수 있도록 내보낼 수 있는 방법이 필요하다.
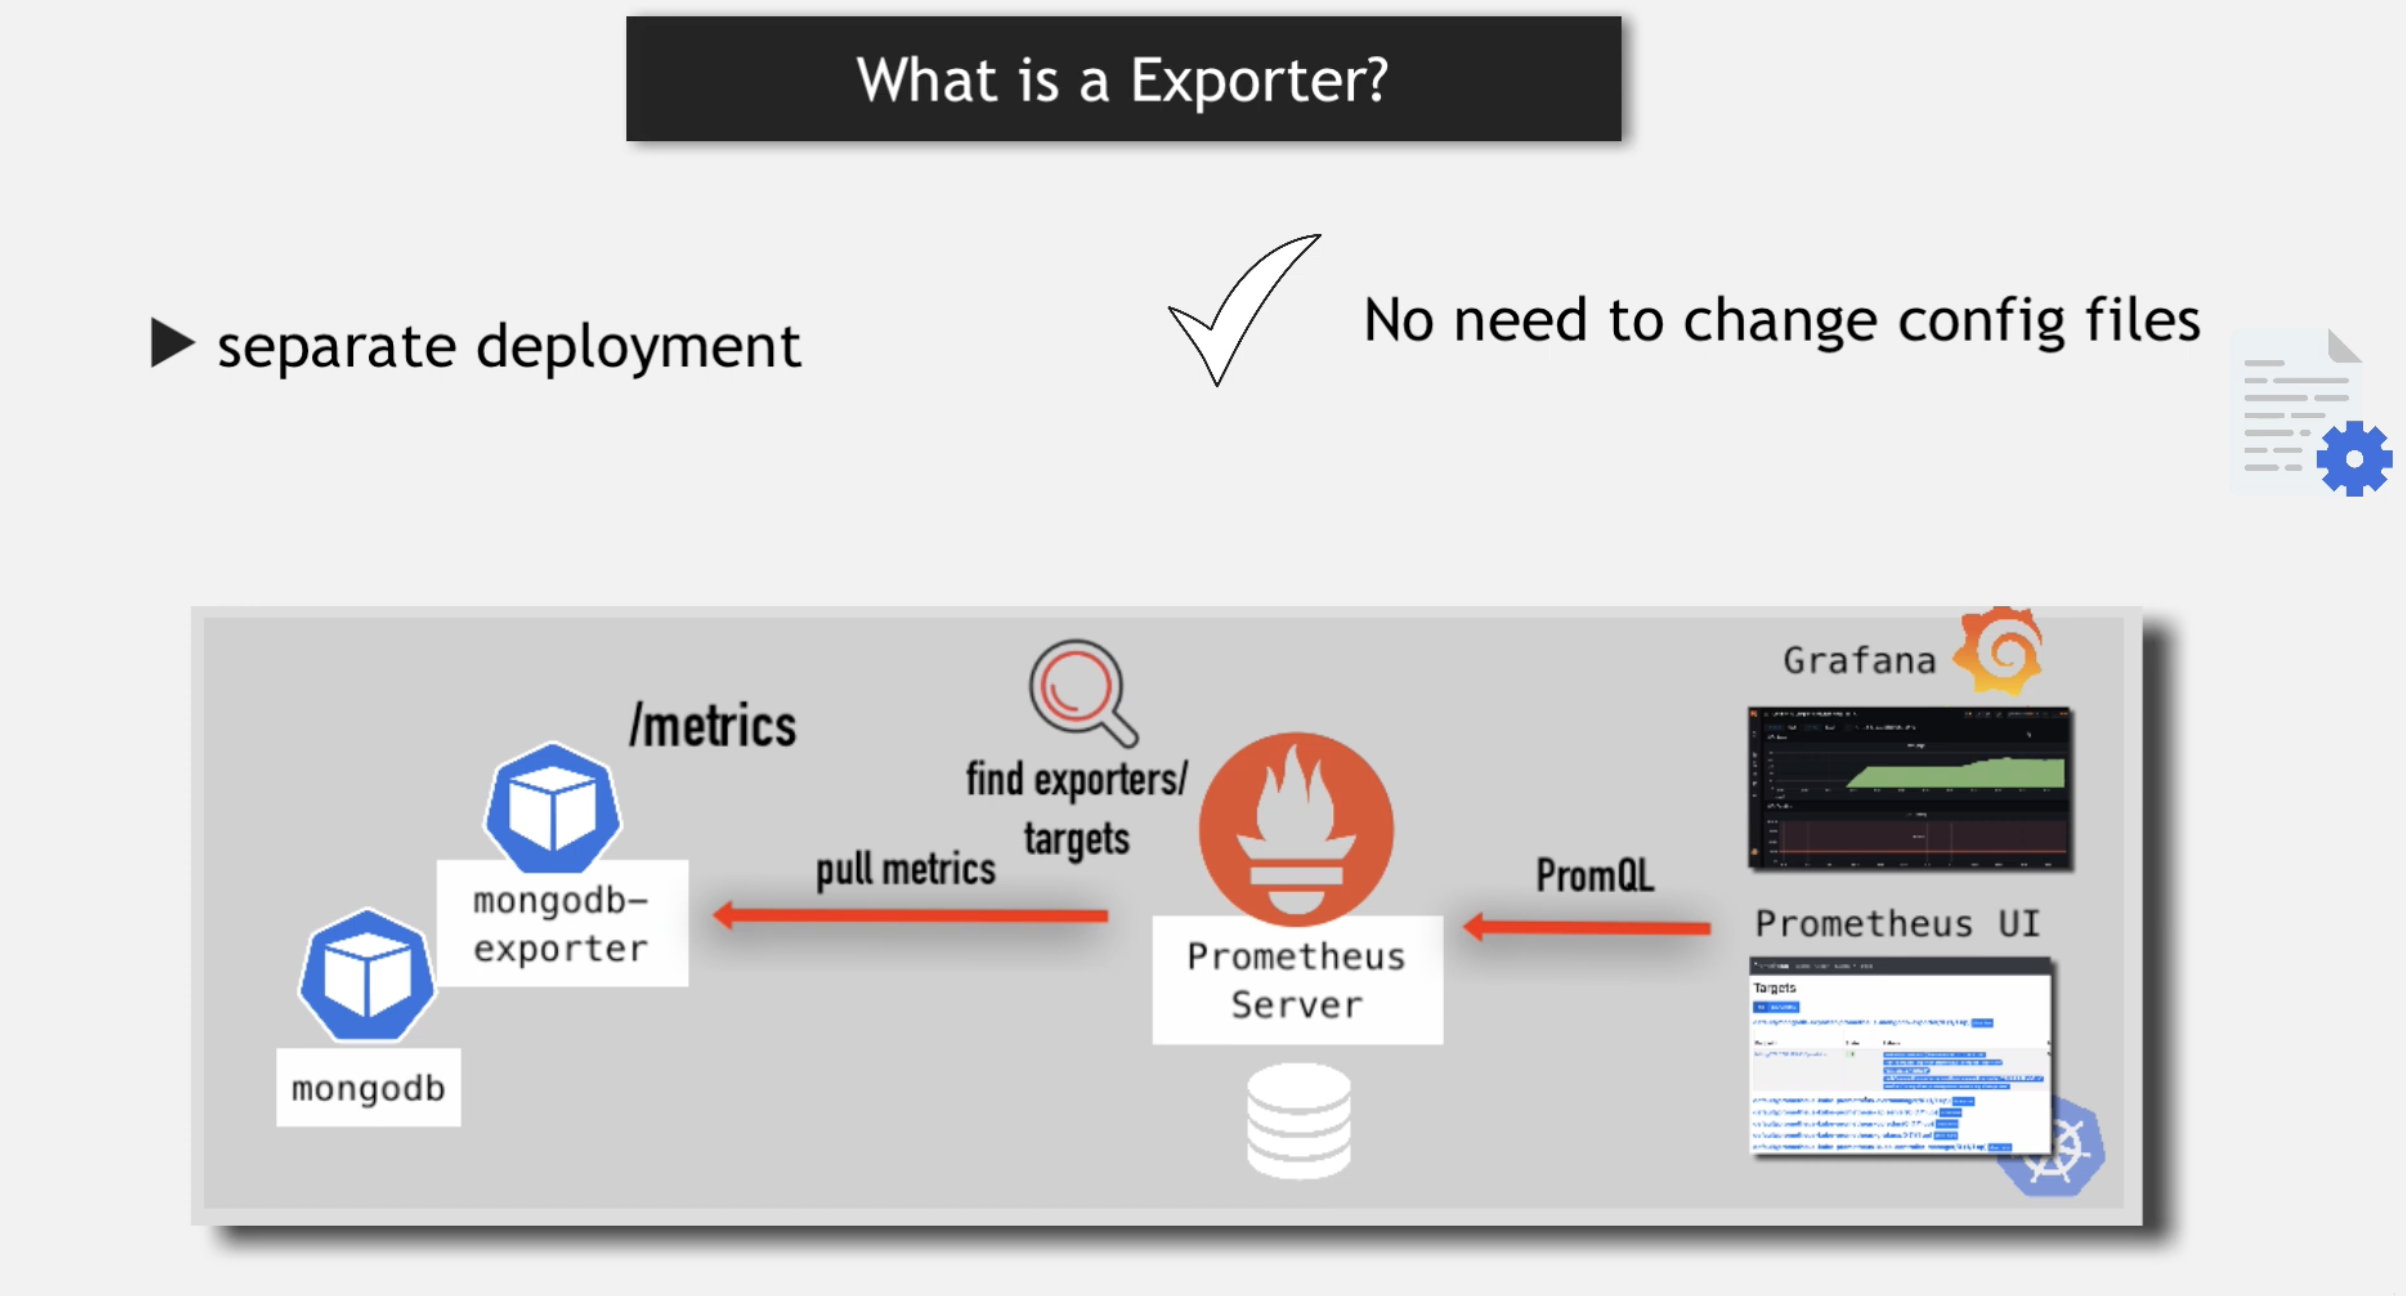
Exporter
Exporter 로 prom-client 를 사용하여 nextjs 서버의 메트릭을 수집하고, Prometheus 서버가 스크랩할 수 있는 형식으로 노출한다.
다음과 같이 Prometheus 서버가 특정 엔드포인트로 접근하여 메트릭을 수집하게 된다.
nextjs 서버에 prom-client 설치
nextjs 서버의 node.js main 파일에 다음과 같이 추가한다.
import promClient from 'prom-client';

// count of http request
const httpRequestCounter = new promClient.Counter({
    name: 'nodejs_http_request_total',
    help: 'Total count of NodeJS HTTP requests',
    labelNames: ['method', 'route', 'statusCode'],
});
// histogram of response duration
const responseTimeHistogram = new promClient.Histogram({
    name: 'nodejs_response_duration_seconds',
    help: 'NodeJS response duration in seconds',
    labelNames: ['method', 'route', 'statusCode'],
    buckets: [0.05, 0.1, 0.25, 0.5, 1.0, 2.5, 5.0, 10.0, 20.0],
});

promClient.register.registerMetric(httpRequestCounter);
promClient.register.registerMetric(responseTimeHistogram);

promClient.collectDefaultMetrics({
    register: promClient.register,
});

// endpoint for prometheus to scrape
app.get('/metrics', async (req, res) => {
    res.setHeader('Content-Type', promClient.register.contentType);
    res.setHeader('Cache-Control', 'no-store');
    const metrics = await promClient.register.metrics();

    res.send(metrics);
});

app.use((req, res, next) => {
    const isL7CheckReq = getIsL7Check(req.url);
    const isMetricsReq = getIsMetrics(req.url);

    if (!isL7CheckReq && !isMetricsReq) {
        const labels = {
            method: req.method,
            route: req.path,
            statusCode: res.statusCode,
        };
        httpRequestCounter.labels(labels).inc();

        const endTime = responseTimeHistogram.startTimer();
        res.on('finish', () => {
            endTime(labels);
        });
    }

    next();
});

function getIsMetrics(url: string) {
    return url === '/metrics';
}
위에서 collectDefaultMetrics 를 통해 다음과 같은 기본 메트릭을 수집할 수 있다.
아래와 같은 메트릭을 통해 앞단의 ingress-nginx 에 exporter 를 두는 경우보다 next nodejs 서버의 정보를 더 자세히 볼 수 있는 장점도 있다.
- Node.js Version
- Node.js Restarts
- CPU Usage
- CPU Time Spent
- Memory Usage
- Active Handlers and Requests
- Event Loop Latency
- GC Duration Rate
- GC Duration
- Heap Memory Usage
- GC Rate
- GC Count
- Heap Space Used
Grafana 대시보드
grafana에서 아래 nodejs-exporter 대시보드 ID로 import 하여 대시보드를 구성한다.
해당 대시보드는 prom-client 를 사용하여 노출된 메트릭을 기반으로 구성되어 있다.
https://grafana.com/oss/prometheus/exporters/nodejs-exporter/?tab=dashboards
그 외 설정에 대해서는 아래 문서를 참고한다.
Alert
Prometheus Alert 을 활용하는 방법과 Grafana Alert 을 활용하는 방법이 있다.
Prometheus의 Alert은 다음 2가지 컴포넌트로 구성되어있다.
- Alert Rule : PromQL을 기반으로 정의하는 알람이 발생할 규칙
- AlertManager : 수신받은 Alert를 다양한 서비스에 notify를 수행
Prometheus Alert 은 고성능이며 Prometheus 중심 모니터링 시스템에서 사용하기에 적합하다.
Grafana Alert 은 Grafana 대시보드 또는 Alert UI 에서 직접 알람을 설정할 수 있고, 시각화된 데이터와 통합 할 수 있으며 다양한 데이터 소스와도 통합하여 Alert 을 설정할 수 있다.
다만 자체적으로 메트릭 데이터를 저장하지 않기 때문에, 성능적으로는 Prometheus Alert 보다 떨어진다.
https://grafana.com/tutorials/alerting-get-started/ 을 참고하여 Grafana Alert 을 설정할 수 있다.
참고
- https://labs.bharatpe.com/nextjs-monitoring-from-setup-to-visualization-with-prometheus-and-grafana
- https://dev.to/oluwatobi2001/optimizing-performance-using-prometheus-with-node-js-for-monitoring-b90
- https://www.youtube.com/watch?v=mLPg49b33sA&list=PLy7NrYWoggjziYQIDorlXjTvvwweTYoNC&index=21
- https://www.youtube.com/watch?v=h4Sl21AKiDg