- Published on
javascript로 performance 측정하기
performance.timing API를 통한 페이지 로드속도 측정하기
참고 : Advanced Page Load Speed Measurement with Google Analytics
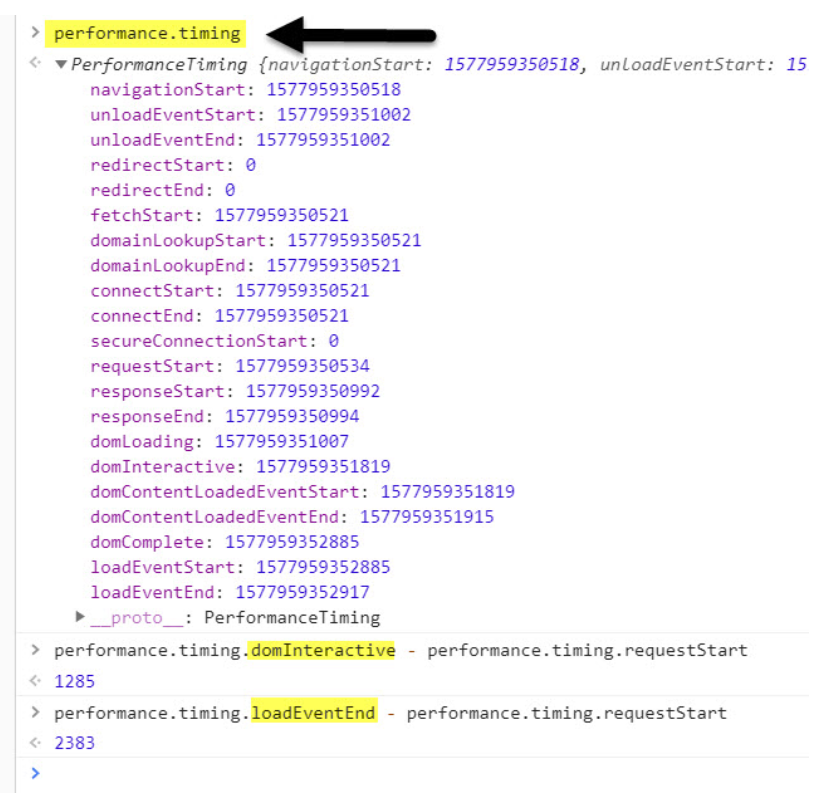
performance.timing 브라우저 내장 API를 사용하여 페이지 로드 완료 까지의 구간별 이벤트 시간을 확인할 수 있다.
값이 0이면 해당 이벤트가 발생하지 않았다는 것을 의미한다.

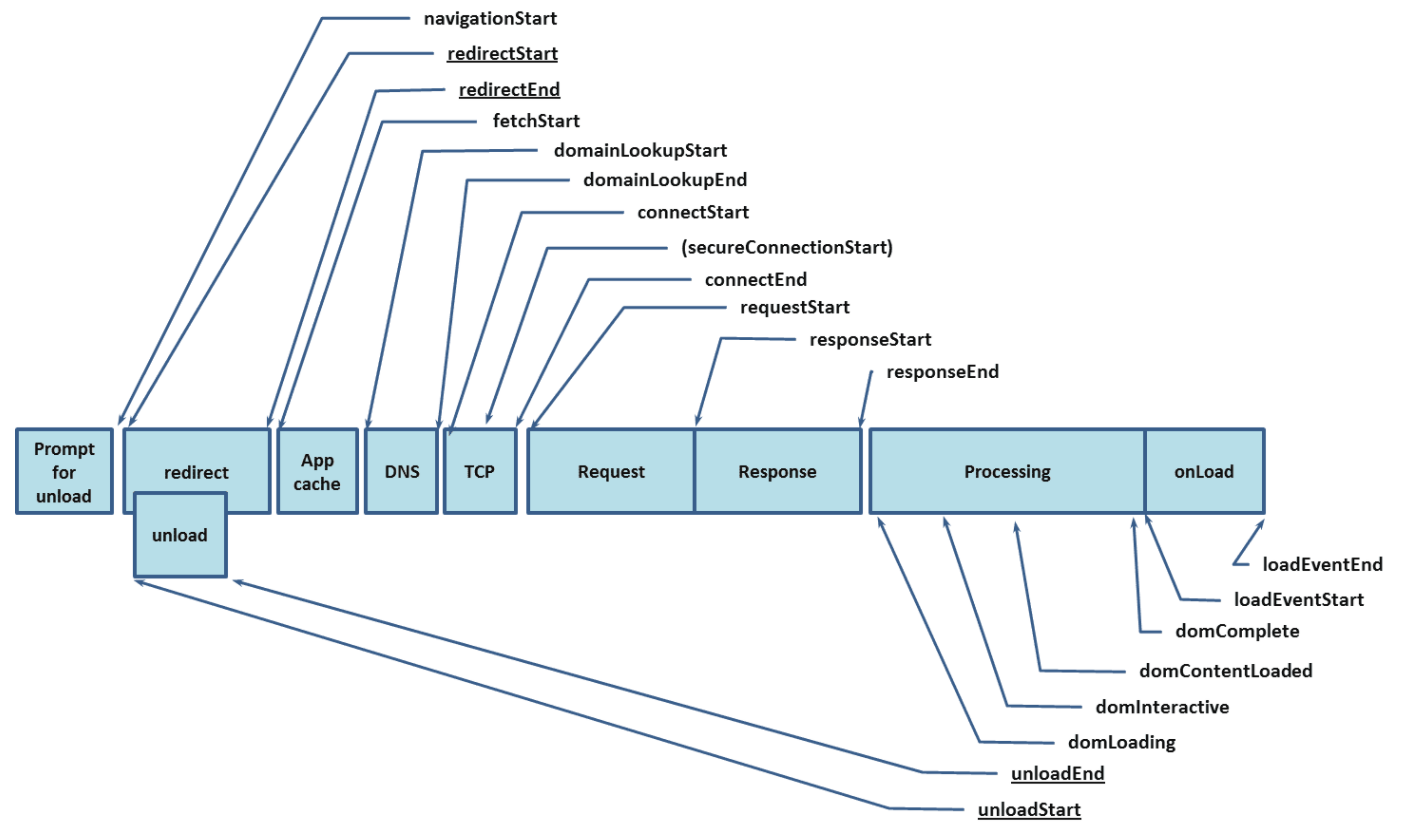
발생하는 순서는 다음의 표와 같다.

위의 타이밍 API를 활용하여 페이지 렌더를 위한 단계별로 얼마나 걸렸는지 계산할 수 있다.
- DOM Interactive Time = domInteractive - responseStart
- DOM Complete Time = domComplete - responseStart
- Page Render Time = domComplete - domLoading
- Total Page Load Time = loadEventEnd - navigationStart
SPA인 경우는 성능 측정을 위해 추가적인 로직이 필요한데, 다음의 Route Change ~ Initial Load 를 계산하는 것으로 보인다. (참고)
Initial Load: Loading Time is equal to whichever is longer: The difference between navigationStart and loadEventEnd.Or the difference between navigationStart and the first time the page has no activity for more than 100ms (activity is defined as ongoing network requests or a DOM mutation).
Route Change: Loading Time is equal to the difference between the user click and the first time the page has no activity for more than 100ms (activity is defined as ongoing network requests or a DOM mutation).
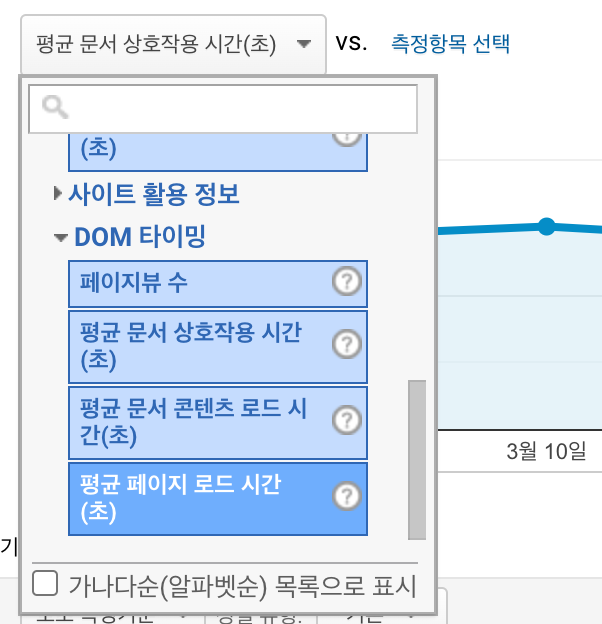
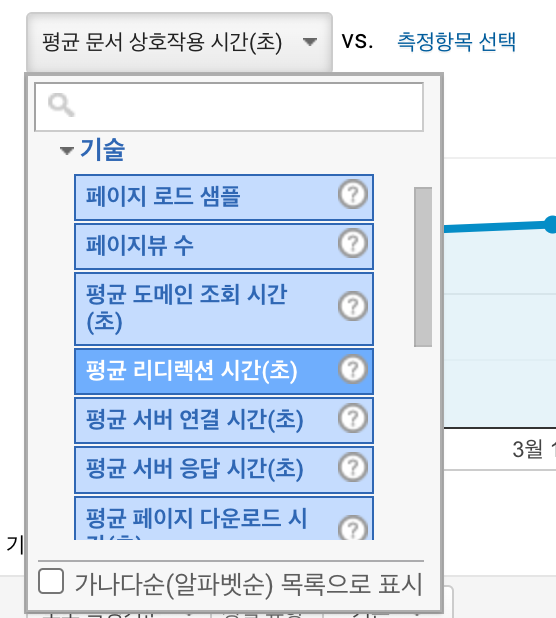
구글 애널리틱스에서도 위에서 계산한 페이지 로드 단계별 시간을 확인할 수 있다.
GA에서 어떤 구간에서 병목이 있는지 항목별로 확인해본다.


javasciprt로 성능 측정하기
참고 : 자바스크립트 함수의 성능 측정하기
Performance API
Performance.now
페이지를 로드한 이후로 지난 ms를 보여준다.
Date.now의 경우에도 performance.now()와 마찬가지로 ms를 리턴하지만, 이는 시스템의 시간에서 Unix epoch(1970-01-01T00:00:00Z)의 차이를 리턴하므로 부정확할 수 있다고 한다.
export const htmlToReact = (html?: string | null) => {
  if (!html) {
    return null;
  }

  const t0 = performance.now();
  const nodes = htmlparser2.parseDOM(html, { decodeEntities: true });
  const t1 = performance.now();
  console.log('###', t1 - t0, 'ms'); // ### 17.899999976158142

  return processNodes(nodes as Node[]);
};
Performance.mark & Performance.measure
performance.mark를 이용하여 performance buffer에 timestamp를 생성하여 마킹을 하고 performance.measure를 이용하여 마킹해둔 정보를 이용해서 측정을 한다.
export const htmlToReact = (html?: string | null) => {
  if (!html) {
    return null;
  }

  performance.mark('parseDOM-start');
  const nodes = htmlparser2.parseDOM(html, { decodeEntities: true });
  performance.mark('parseDOM-end');
  performance.measure('parseDOM', 'parseDOM-start', 'parseDOM-end');
  console.log('###', performance.getEntriesByName('parseDOM')[0].duration); // ### 23.199999928474426

  return processNodes(nodes as Node[]);
};
console.time
console.time과 console.timeEnd를 호출하여 측정한다.
export const htmlToReact = (html?: string | null) => {
  if (!html) {
    return null;
  }

  console.time('parseDOM')
  const nodes = htmlparser2.parseDOM(html, { decodeEntities: true });
  console.timeEnd('parseDOM')

  return processNodes(nodes as Node[]);
};
사용자 지정 지표 API
Lighthouse나 Sentry의 Performance처럼 직접 성능 대시보드나 성능 측정 서비스를 만들어야 한다면 W3C Web Performance Working Group에서 책정하고 있는 사용자 지정 지표를 사용해야 한다.
해당 지표의 API 종류는 다음과 같다. 이들 API를 이용해서 Web vitals에 필요한 대부분의 데이터를 수집할 수 있다.
- overview
- User Timing API
- Long Tasks API
- Element Timing API
- Navigation Timing API
- Resource Timing API
- Server Timing
또한 웹 성능 측정을 할 수 있도록 제공해주는 다음의 여러 도구들도 활용할 수 있다.
개발 환경에서 측정하기
서비스를 이용한 측정 (Real User Monitoring)
Sentry 서비스는 흔히 에러 로그를 수집하고 대응하기 위해서 사용하는 도구로 알려져 있다.
Sentry는 익히 알고 있는 기능 뿐 아니라 Performance Monitoring 기능도 제공하는데 여기에 Web Vitals 측정 기능도 포함하고 있다.